NSW emissions are about 19.6 tonnes per capita. This is below the national average of 23.2 tonnes per capita.
Across most economic sectors emissions have declined since 1990, including mining, industrial processes, agriculture, land clearing and waste. In contrast, emissions from transport have undergone almost uninterrupted growth, with forecasts indicating continued growth. Overall, stationary energy emissions (primarily electricity generation) also rose from 1990, peaking in 2007 and then declining quickly. Together, the stationary energy and transport sectors represent 59% of total NSW emissions, and forecasts indicate the emissions from both will grow in the future.
To help meet its goal of increasing use of lower emissions energy sources and improving energy efficiency, the NSW Government is implementing the NSW Renewable Energy Action Plan and the NSW Energy Efficiency Action Plan. It continues to support a national Renewable Energy Target and the Greenhouse and Energy Minimum Standards initiative; along with a suite of other actions to improve energy efficiency and lower power emissions. The NSW Government maintains biofuels mandates as a means of increasing use of lower emissions energy sources in the transport sector.
Related themes: 3 Energy consumption | 4 Transport
NSW indicators
| Indicator and status | Environmental trend |
Information availability |
|
|---|---|---|---|
| Atmospheric concentrations of greenhouse gases | Increasing impact | ✔ ✔ ✔ | |
| Total annual NSW greenhouse gas emissions | Decreasing impact | ✔ ✔ ✔ | |
| Annual NSW per capita greenhouse gas emissions | Decreasing impact | ✔ ✔ ✔ | |
Notes: Terms and symbols used above are defined in About SoE 2015 at the front of the report.
Context
The global mean temperature has risen by 0.85°C (± 0.2°C) since 1880. All of the warmest 20 years on record have occurred since 1990.
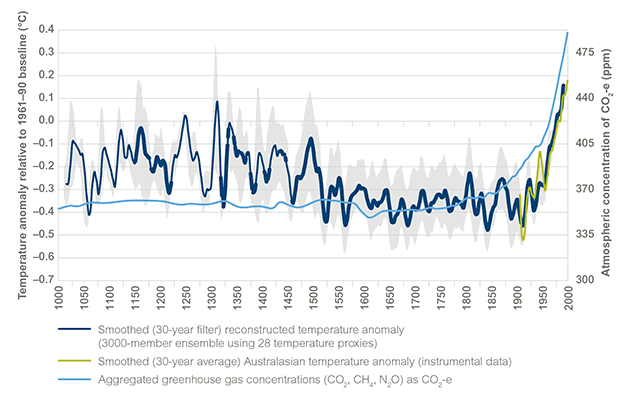
Temperatures in the Australasian region are already rising quickly to their highest levels in more than a thousand years (Figure 5.1). Since 1910 Australia’s climate has warmed by 0.9°C, extreme fire weather has increased and rainfall patterns have changed (BOM & CSIRO 2014).
It is the view of most scientists that the dominant cause of recent warming has been human-induced greenhouse gas emissions and not natural climate variability (BOM & CSIRO 2012).
Greenhouse gases in the atmosphere, along with physical processes such as solar heat absorption by vegetation, oceans, atmospheric dust and other dark materials, act to maintain an average global surface temperature of about 14°C, which would otherwise be about –20°C (IPCC 2007, p.946).
Changing greenhouse gas concentrations will alter the heat balance of the atmosphere. For most of the past 2000 years, global atmospheric concentrations of greenhouse gases have been fairly stable and only since the Industrial Revolution (c.1750) have they increased significantly. This trend is also seen in the Australasian region (Figure 5.1).
The increased use of fossil fuels since the mid-18th century, along with agricultural and land-use changes, and other activities, have led to a build-up of greenhouse gases, such as carbon dioxide (CO2), methane, nitrous oxide, ozone and manufactured gases like chlorofluorocarbons (IPCC 2007; CSIRO 2011). This has resulted in extra heat being trapped by the atmosphere, showing up as an increase in global surface temperatures (IPCC 2007, p.4). In terms of both volume and effect, CO2 is the largest single contributor, being responsible for approximately 63% of the change in the climate observed since pre-industrial times (CSIRO 2011).
Figure 5.1: Australasian summer temperature reconstruction, temperature observations, and CO2-e, since AD 1000

Source: Gergis et al. in revision; CSIRO data; Hartmann et al. 2013, Table 2.1
Notes: This temperature reconstruction is based on 28 temperature proxies from the Australasian region and was generated using multivariate principal component regression. The most reliable periods of the reconstruction are shown by the thick sections of the dark blue line with less reliability indicated by the thin dark blue line. The light green line represents the instrumental data. Statistical error bands from the regression analysis are shown in light grey.
The light blue CO2-e line is composed of the sum of the atmospheric concentrations of three main greenhouse gases (CO2, CH4, N2O; as measured in ice cores from Law Dome, Antarctica) multiplied by their individual radiative efficiencies relative to CO2.
Data for Figure 5.1
Concentrations of major greenhouse gases now substantially exceed the highest concentrations of the past 800,000 years, as recorded in ice cores. The mean rates of increase in atmospheric concentrations over the past century are unprecedented in the last 22,000 years (IPCC 2013).
Across the international Greenhouse Gas Reference Network concentrations of CO2 are observed to be about 2–3 ppm higher in the northern hemisphere (e.g. at Mauna Loa in Hawaii) compared to those in the southern hemisphere (e.g. at Cape Grim in north-west Tasmania). Mauna Loa data shows carbon dioxide concentrations are now increasing at about 2 ppm per year, with monthly mean values exceeding 400 ppm in 2014.
The last time that CO2 concentrations were comparable to these modern levels was 10 to 15 million years ago, when the world climate was, on average, 3 to 6°C warmer than at present and sea levels were much higher (Tripati et al 2009; Allison et al. 2011).
Status and trends
Global greenhouse gas emissions
In 2010, global anthropogenic greenhouse gas emissions reached 49 ± 4.5 GtCO2-e (gigatonnes of CO2 equivalent) (IPCC 2014). Fossil fuel (coal, oil and gas) combustion and industrial processes contributed about 78% of the increase in emissions of CO2 from 1970 to 2010 (IPCC 2014). Economic and population growth continued to be the key drivers of increases in CO2 emissions around the world (IPCC 2014).
Australian greenhouse gas emissions
Using the same accounting methodology as the Intergovernmental Panel on Climate Change (IPCC) and United Nations Framework Convention on Climate Change (UNFCCC), 549 Mt CO2-e of greenhouse gases were emitted in Australia during 2013 (DE 2015a). This makes Australia one of the highest per capita emitters of greenhouse gases in the world (IEA 2011, pp. 97–99). Australia’s per capita emissions for fuel combustion (16.7 tonnes CO2-e per person in 2012), were significantly higher than the Organisation for Economic Cooperation and Development (OECD) average and the non-OECD average of 9.7 and 3.2 tonnes CO2-e per person respectively (IEA 2014, p.84).
NSW greenhouse gas emissions
According to the UNFCCC accounting methodology, total NSW greenhouse gas emissions for 2013, excluding emissions and removals from Land Use, Land Use Change and Forestry (LULUCF) activities, were 146.7 Mt CO2-e (27% of the national total) (DE 2015b). This is a decrease of 1% since 1990; it is also a decrease of 4% since 2000 and 11% since emissions peaked in 2007. NSW’s mix of economic activities and energy policies helps to keep its annual per capita emissions (19.6 tonnes in 2013) below the national average (23.2 tonnes) (DE 2015a, p.33).
NSW emissions components
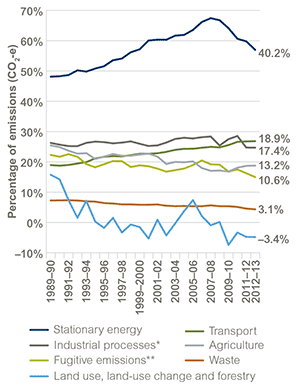
Emissions from the combustion of fossil fuels account for 66% of NSW emissions, with a further 10% from coal mining emissions (Figure 5.2).
Stationary energy emissions (primarily fuel combustion for electricity and other gas use) increased by 9% since 1990 in NSW, which reflects population and economic growth. This increase is tempered by:
- energy efficiency improvements
- the deployment of gas-fired and renewable power stations sources
- reduced demand due to the impacts of the global financial crisis.
Figure 5.2: NSW greenhouse gas emissions components, 1989–90 to 2012–13

Source: DE 2015b
Notes: * Includes fuel combustion for manufacturing industries and construction, etc.
** 97% of NSW fugitive emissions come from coal mining.
Data for Figure 5.2
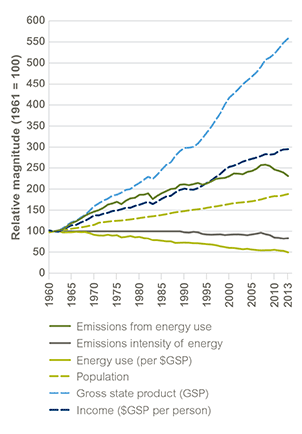
Electricity generation and use in NSW is expected to resume growing, albeit slowly (see Figure 5.3, and Figure 3.4 in Theme 3: Energy consumption).
The transport sector is the fastest growing component of NSW-generated greenhouse gases. This reflects the importance of motor vehicles for both passenger and freight transport within the state. Although transport energy consumption was relatively stable from 2010–11 to 2012–13 (see Theme 3: Energy consumption), the transport sector is, nevertheless, a significant source of greenhouse gas emissions for NSW because of its growth rate and the size of its contribution to total emissions, which was 18.9% in 2013.
Figure 5.3: Trends in NSW energy use, compared with key NSW statistics, 1960–2013

Source: OEH analysis based on ABS 2008; ABARES 2011; ABS 2011a; ABS 2011b; DCCEE 2011
Data for Figure 5.3
With the first Kyoto Protocol commitment period (2008–2012) at an end, emissions estimates from LULUCF activities have been finalised. This has involved accounting for (for example) reafforestation undertaken since 1990, but re-cleared before 2012. This reveals that this sector has gone from being a net generator of emissions, to a net sink for emissions.
Pressures
Global emissions
The Copenhagen Accord declared that deep cuts in emissions are required to hold the increase in global temperature below 2°C (UNFCCC 2009). In effect, world-wide emission reductions of around 5% per year would be required. This corresponds to limiting cumulative, post-1750, emissions to the equivalent of one trillion tonnes of carbon (Raupach et al. 2011). Business-as-usual activities will see the trillion tonne level exceeded in about 35 years (CSIRO 2011, Ch. 2).
NSW emissions
Historically, NSW emissions have been strongly correlated to population growth and economic activity (Figure 5.3). As economic activity relies heavily on energy, emissions from energy consumption are the most significant and the largest contributor to NSW emissions (40%).
In recent years, electricity consumption has declined in NSW due to a variety of economic factors, such as increased local generation by residential and commercial users and improvements to energy efficiency (see Theme 3: Energy consumption). If these factors continue they should produce a gradual disconnect between emissions from the energy sector and economic and population growth (Figure 5.3). Nevertheless, population and economic growth from 2014–15 to 2024–25 is projected to be sufficient to grow electricity demand at 1% per annum (see Figure 3.4 in Theme 3: Energy consumption).
A large part of the emissions expected over the next few decades are already locked in, as much of the energy generation infrastructure has a decade-long economic lifespan (Davis et al. 2010); unless the (as yet unproven) carbon capture and storage technologies can be reliably and economically implemented. However, the early decommissioning of older, less efficient, power stations may be facilitated by the rate with which end-users adopt new (low or zero emission) generation capacity, as well as energy efficiency improvements.
Conversely, economic and policy factors can conspire to increase emissions. For example, NSW imports about 10% of its power from other states via the National Electricity Market (NEM). Compared with NSW, the other members of the NEM commonly use brown coal for power generation, which is cheaper, but more emissions-intensive than black coal. Following the abolition of the federal carbon price, early indications are that the NEM’s average carbon-intensity has increased (Pitt & Sherry 2015; Hannam & Arup 2015).
Demand for gas is forecast to decrease at an average annual rate of 1.8% over the next five years (AEMO 2014a). With residential gas consumption growing, the decrease in total gas demand is driven by industrial closures and declining gas-fired electricity generation.
NSW emissions by economic sector
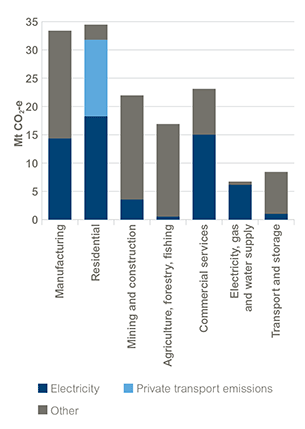
Greenhouse gas emissions produced during electricity generation can be attributed to the final consumer of the generated electricity. This shows the residential sector is making the largest contribution to greenhouse gas emissions in NSW (35 Mt CO2-e, about 24%), closely followed by manufacturing (33 Mt CO2-e, about 23%) (Figure 5.4).
Figure 5.4: NSW greenhouse gas emissions by end use sector, 2012–13

Source: OEH estimates based on Australian Department of the Environment data
Data for Figure 5.4
Responses
Using energy more efficiently
The NSW Energy Efficiency Action Plan (EEAP) (OEH 2013) aims to implement measures that will reduce the cost of consumers’ power bills and improve economic performance. The EEAP contains 30 actions to grow the market for energy saving products and services, and to position the NSW Government to lead by example. Actions include:
- enhancing the Energy Savings Scheme – over the next decade, energy efficiency projects are expected to deliver 11,000 GWh of energy savings and $1.6 billion in bill savings
- leading by example by implementing the NSW Government Resource Efficiency Policy (GREP) (OEH 2014) – this responds to rising resource costs and economic, environmental and community impacts by setting measures, targets and minimum standards that will drive resource efficiency in the areas of energy, water, waste and clean air for government (e.g. through energy efficiency projects, encouraging renewable energy development such as mid-scale solar development, and reducing waste generation).
The NSW Climate Change Fund, established in 2007, has been a key funding mechanism for EEAP and related programs (see also Theme 3: Energy consumption).
The NSW Government also supports various state and national standards that are coordinated through the Council of Australian Governments (COAG), such as:
- Greenhouse and Energy Minimum Standards (GEMS), which regulates energy efficiency and standards for appliances and other products (see Theme 3: Energy consumption)
- National Australian Built Environment Rating System (NABERS), which rates buildings using measured environmental impacts
- The National Construction Code, which sets out minimum standards for energy efficiency in building design and construction.
Lower emissions energy
Renewable energy sources are increasingly being used for electricity, almost doubling between 2008 to 2013 to 12.9% (9335 GWh) of total energy consumption in NSW (dropping to 10.8% in 2014, see Theme 3: Energy consumption).
As at July 2015, around 325,000 households and small businesses across NSW had solar photovoltaic (PV) systems with a capacity of more than 960 MW (Clean Energy Regulator data). Wind power is also expected to be the main new source over the next decade, with 3.98 GW of new wind generation forecasted to be connected to the NEM power grid by 2020, half of which is planned for installation in NSW (AEMO 2014b).
The NSW Renewable Energy Action Plan (NSW Government 2013) (REAP) will position NSW to offer increased renewable energy at the lowest cost to customers. The REAP contains 24 actions to attract renewable energy investment, build community support, and grow renewable energy expertise, such as:
- providing $64.9 million to Solar Flagships, which will deploy two large-scale solar PV power stations with a total generation capacity of 155 MW, including the largest solar power station in the Southern Hemisphere at Nyngan
- establishing the Regional Clean Energy Program, which is helping communities to produce renewable energy locally.
The NSW Government also has policies beyond these plans that help reduce greenhouse gas emissions from energy, which include mandating biofuel supply in NSW to help support the development of a market for cleaner and alternative fuels. Biofuels, such as ethanol and modified vegetable oil (biodiesel), can reduce greenhouse gas emissions, create jobs in regional NSW, help farmers, and reduce reliance on foreign fuel imports.
In addition, government actions to support public transport use can help to reduce energy use and greenhouse gas emissions from the transport sector (see Theme 4: Transport).
NSW also supports the Australian Government’s 2014 Renewable Energy Target (RET) of 41,000 GWh of renewable generation by 2020. Progressing this national target links with the NSW REAP.
Carbon capture and storage
Through the $100 million Coal Innovation NSW Fund, the Government is carrying out research, development, demonstration, and public awareness raising of low emissions coal technologies. Research and development projects funded include:
- retrofitting existing power stations to enable post-combustion capture and storage of carbon dioxide (e.g. the Delta carbon capture and storage demonstration project)
- the NSW CO2 storage assessment project which is identifying potential geological CO2 storage basins for permanent storage of CO2 (Darling Basin is showing early indications of good storage potential)
- capturing and using methane emissions from ‘gassy’ coal mines.
Carbon sequestration
In addition to carbon capture from electricity production, careful land management can avoid greenhouse gas emissions or sequester (store) carbon in the plants and soil. It can also protect biodiversity and maintain landscape values.
As public lands in NSW (around half the state) store about 1.5 billion tonnes of carbon, the NSW Government is working to improve the management of carbon across all public lands (e.g. see NSW LC 2013).
The Australian Government’s Emissions Reduction Fund provides incentives for storing carbon in the agriculture and forestry sectors as well as emissions avoidance across the economy. This program now integrates the former Carbon Farming Initiative that ran between September 2011 and December 2014.
Future opportunities
Research and development into cost-effective technologies continue to help reduce emissions, for example:
- carbon mineralisation – the Coal Innovation NSW Fund is partnering with the Australian Government and Orica in Mineral Carbonation International, a project trialling a new technology that permanently and safely stores CO2 by transforming captured emissions into forms of carbonate rock for potential use as new green building materials in the construction industry
- improving combustion efficiency – such as by chemical looping air separation technologies to produce oxygen for use in oxy-fuel combustion power stations; and the direct carbon fuel cell (both being are being funded by the Coal Innovation NSW Fund)
- improving light and heavy vehicle efficiency
- enabling systems and technologies for very high penetration renewable energy generation
- capturing and using methane emissions from ‘gassy’ coal mines.
There are opportunities within the agriculture and forestry sectors to mitigate greenhouse gas emissions through practice changes that are both profitable and sustainable.
Key opportunities being investigated by NSW DPI in conjunction with the Australian Government include:
- increased soil organic carbon
- increases in perennial vegetation in agriculture
- reduced livestock methane emissions
- reduced emissions from nitrogenous fertilisers
- utilisation of agricultural and forestry residues for bioenergy and biochar.
Additional opportunities include capturing fugitive emissions, e.g. methane from landfill waste decomposition; and waste heat from industrial processes.
References
ABARES 2011, Australian Energy Statistics: Energy update 2011, Australian Bureau of Agricultural and Resource Economics and Sciences, Canberra [www.industry.gov.au/Office-of-the-Chief-Economist/Publications/Pages/Australian-energy-statistics.aspx] Cited in: Ch 5
ABS 2008, Australian Historical Population Statistics, 2008, cat. no. 3105.0.65.001, Australian Bureau of Statistics, Canberra [www.abs.gov.au/AUSSTATS/abs@.nsf/allprimarymainfeatures/3FFF7B942B72A553CA257D560017885D?opendocument] Cited in: Ch 5; Ch 1
ABS 2011a, Regional Population Growth, Australia, 2010–11, cat. no. 3218.0, Australian Bureau of Statistics, Canberra [www.abs.gov.au/AUSSTATS/abs@.nsf/allprimarymainfeatures/81F229EB4F954422CA257A4B00147807?opendocument] Cited in: Ch 5
ABS 2011b, Australian National Accounts: State accounts, 2010–11, cat. no. 5220.0, Australian Bureau of Statistics, Canberra [www.abs.gov.au/AUSSTATS/abs@.nsf/allprimarymainfeatures/DA07CC89BDB98D90CA257ABC000CDB1A?opendocument] Cited in: Ch 5; Ch 2
AEMO 2014a, National Gas Forecasting Report 2014, Australian Energy Market Operator, Melbourne [www.aemo.com.au/Gas/Planning/Forecasting/National-Gas-Forecasting-Report] Cited in: Ch 5
AEMO 2014b, 2014 National Transmission Network Development Plan, Australian Energy Market Operator, Melbourne [www.aemo.com.au/Electricity/Planning/National-Transmission-Network-Development-Plan] Cited in: Ch 5
Allison, I, Bindoff, NL, Bindschadler, R, Cox, PM, de Noblet, N, England, MH, Francis, JE, Gruber, N, Haywood, AM, Karoly, DJ, Kaser, G, Le Quéré, C, Lenton, TM, Mann, ME, McNeil, BI, Pitman, AJ, Rahmstorf, S, Rignot, E, Schellnhuber, HJ, Schneider, SH, Sherwood, SC, Somerville, RCJ, Steffen, K, Steig, E, Visbeck, M & Weaver, A 2011, The Copenhagen Diagnosis: Updating the world on the latest climate science, second edition, Elsevier Science & Technology Inc, Oxford, UK [www.copenhagendiagnosis.com] Cited in: Ch 5
BOM & CSIRO 2012, State of the Climate Report 2012, Bureau of Meteorology and CSIRO, Canberra [www.bom.gov.au/state-of-the-climate/documents/Climate-Snapshot-2012-Brochure.pdf] Cited in: Ch 5
BOM & CSIRO 2014, State of the Climate Report 2014, Bureau of Meteorology and CSIRO, Canberra [www.bom.gov.au/state-of-the-climate] Cited in: Ch 5
CSIRO 2011, Climate Change: Science and solutions for Australia, Cleugh, H, Stafford Smith, M, Battaglia, M & Graham, P (eds), CSIRO Publishing, Collingwood, Victoria [www.publish.csiro.au/nid/220/issue/6210.htm] Cited in: Ch 5(1); Ch 5(2); Ch 5(3)
Davis, SJ, Caldeira, K & Matthews, HD 2010, ‘Future CO2 emissions and climate change from existing energy infrastructure’, Science, 329(5997), pp. 1330–33 [dx.doi.org/10.1126/science.1188566] Cited in: Ch 5
DCCEE 2011, Australia’s Emissions Projections 2010, Department of Climate Change and Energy Efficiency, Canberra [webarchive.nla.gov.au/gov/20140801060611/http://www.climatechange.gov.au/climate-change/greenhouse-gas-measurement-and-reporting/australias-emissions-projections/australias-emissions-projections-2010] Cited in: Ch 5
DE 2015a, National Inventory Report 2013 – Volume 1, Department of the Environment, Canberra [www.environment.gov.au/system/files/resources/7d7f7ef6-e028-462e-b15c-ede14e222e65/files/national-inventory-report-2013-vol1.pdf] Cited in: Ch 5(1); Ch 5(2)
DE 2015b, State and Territory Greenhouse Gas Inventories 2013, Department of the Environment, Canberra [www.environment.gov.au/system/files/resources/9e33b185-1fb6-44b7-9d72-6979f3427b94/files/state-territory-inventories-2013.pdf] Cited in: Ch 5(1); Ch 5(2)
Gergis, J, Neukom, R, Gallant, A, Phipps, SJ, Karoly, D & PAGES Aus2K Project Members, in revision, ‘Evidence of unusual late 20th century warming from an Australasian temperature reconstruction spanning the last millennium’, Journal of Climate. Cited in: Ch 5
Hannam, P & Arup, T 2015, ‘Brown coal extends rebound, pushing up power sector emissions: Pitt & Sherry’, Sydney Morning Herald, 5 May [www.smh.com.au/environment/brown-coal-extends-rebound-pushing-up-power-sector-emissions-pitt--sherry-20150504-1mchww] Cited in: Ch 5
Hartmann, DL, Klein Tank, AMG, Rusticucci, M, Alexander, LV, Brönnimann, S, Charabi, Y, Dentener, FJ, Dlugokencky, EJ, Easterling, DR, Kaplan, A, Soden, BJ, Thorne, PW, Wild, M & Zhai, PM 2013, ‘Observations: Atmosphere and Surface’, in: Climate Change 2013: The physical science basis – contribution of Working Group I to the Fifth Assessment Report of the Intergovernmental Panel on Climate Change, Stocker, TF, Qin, D, Plattner G, Tignor, MMB, Allen, SK, Boschung, J, Nauels, A, Xia, Y, Bex, V & Midgley, P (eds), Cambridge University Press, Cambridge UK and New York, USA [www.ipcc.ch/pdf/assessment-report/ar5/wg1/WG1AR5_Chapter02_FINAL.pdf] Cited in: Ch 5
IEA 2011, CO2 Emissions from Fuel Combustion: Highlights – 2011 edition, International Energy Agency, Paris [www.iea.org/media/statistics/co2highlights.pdf] Cited in: Ch 5
IEA 2014, CO2 Emissions from Fuel Combustion: Highlights – 2014 edition, International Energy Agency, Paris [www.iea.org/publications/freepublications/publication/CO2EmissionsFromFuelCombustionHighlights2014.pdf] Cited in: Ch 5
IPCC 2007, Climate Change 2007: The physical science basis – contribution of Working Group I to the Fourth Assessment Report of the Intergovernmental Panel on Climate Change, Solomon, S, Qin, D, Manning, M, Chen, Z, Marquis, M, Averyt, K, Tignor, M & Miller, H (eds), Cambridge University Press, Cambridge UK and New York, USA [www.ipcc.ch/publications_and_data/publications_ipcc_fourth_assessment_report_wg1_report_the_physical_science_basis.htm] Cited in: Ch 5(1); Ch 5(2); Ch 5(3)
IPCC 2013, Climate Change 2013: The physical science basis – contribution of Working Group I to the Fifth Assessment Report of the Intergovernmental Panel on Climate Change, Stocker, TF, Qin, D, Plattner, G, Tignor, MMB, Allen, SK, Boschung, J, Nauels, A, Xia, Y, Bex, V & Midgley, P (eds), Cambridge University Press, Cambridge UK and New York, USA [www.ipcc.ch/report/ar5/wg1] Cited in: Ch 5
IPCC 2014, Climate Change 2014: Synthesis Report, Contribution of Working Groups I, II and III to the Fifth Assessment Report of the Intergovernmental Panel on Climate Change, [Core Writing Team, Pachauri, RK & Meyer, L (eds)], IPCC, Geneva, Switzerland [www.ipcc.ch/pdf/assessment-report/ar5/syr/SYR_AR5_FINAL_full.pdf] Cited in: Ch 5(1); Ch 5(2); Ch 5(3)
NSW Government 2013, Renewable Energy Action Plan, NSW Trade & Investment, Sydney [www.resourcesandenergy.nsw.gov.au/energy-consumers/sustainable-energy/renewable-energy-action-plan] Cited in: Ch 5; Ch 3
NSW LC 2013, Management of public land in New South Wales, NSW Parliament, Legislative Council, General Purpose Standing Committee No. 5, Report no. 37, Sydney [www.parliament.nsw.gov.au/prod/parlment/committee.nsf/0/74DA1CD968BEB279CA257B6C00012C86?open&refnavid=CO5_2] Cited in: Ch 5
OEH 2013, NSW Energy Efficiency Action Plan, Office of Environment and Heritage, Sydney [www.environment.nsw.gov.au/energyefficiencyindustry/energy-efficiency-policy.htm] Cited in: Ch 5: Ch 3
OEH 2014, Government Resource Efficiency Policy, Office of Environment and Heritage, Sydney [www.environment.nsw.gov.au/government/140567-resource-efficiency.htm] Cited in: Ch 5; Ch 3
Pitt & Sherry 2015, CEDEX® Electricity Update May 2015, Pitt & Sherry, Melbourne [www.pittsh.com.au/assets/files/Cedex/CEDEX%20Electricity%20Update%20May%202015.pdf] Cited in: Ch 5
Raupach, MR, Canadell, JG, Ciais, P, Friedlingstein, P, Rayner, PJ & Trudinger, CM 2011, ‘The relationship between peak warming and cumulative CO2 emissions, and its use to quantify vulnerabilities in the carbon–climate–human system’, Tellus Series B, 63(2), pp. 145–64 [dx.doi.org/10.3402/tellusb.v63i2.16196] Cited in: Ch 5
Tripati, AK, Roberts, CD & Eagle, RA 2009, ‘Coupling of CO2 and ice sheet stability over major climate transitions of the last 20 million years’, Science, 326(5958), pp. 1394–98 [dx.doi.org/10.1126/science.1178296] Cited in: Ch 5
UNFCCC 2009, Copenhagen Accord: Draft decision – CP.15, United Nations Framework Convention on Climate Change, 7–18 December 2009, Copenhagen [unfccc.int/resource/docs/2009/cop15/eng/l07.pdf] Cited in: Ch 5

