Summary – UNSW greenhouse gas survey in Western Sydney
Better regulation of fugitive methane emissions is a high priority for the EPA and will significantly contribute to NSW achieving the objectives of its NSW Net Zero Plan.
We are investigating advances in the measurement of greenhouse gases (including methane) that can be used to inform our regulatory approaches.
As an early step in this journey, we commissioned the University of NSW to conduct a greenhouse gas survey using car-based technologies across several suburbs in Western Sydney. The University of NSW is a specialist in greenhouse gas measurement and is furthering the development of techniques through their research programs.
What the survey did
The study demonstrated new techniques for measuring greenhouse gases (GHGs), especially methane. The car-based survey measured the concentrations of methane (CH4), carbon dioxide (CO2) and carbon monoxide (CO) along public roads located in Eastern Creek, Minchinbury, Arndell Park, and the industrial/agricultural portions of Horsley Park. Some parts of Prospect, Pemulwuy and Wetherill Park were also surveyed.
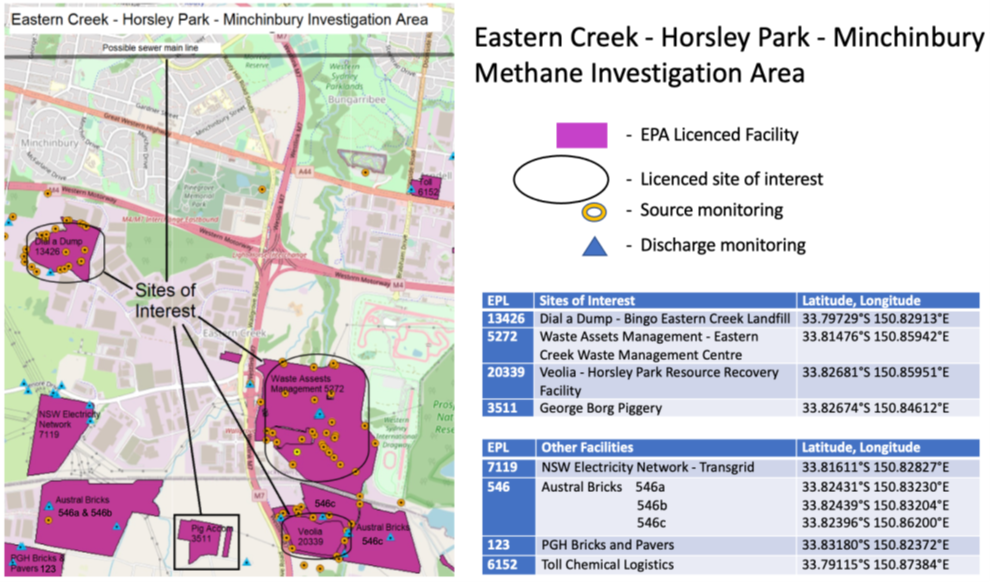
This area includes EPA licensed facilities, unlicensed facilities, and the potential for natural sources of methane emissions. Refer to Figure 1 below for a map of the facilities surveyed.

How the gases were measured
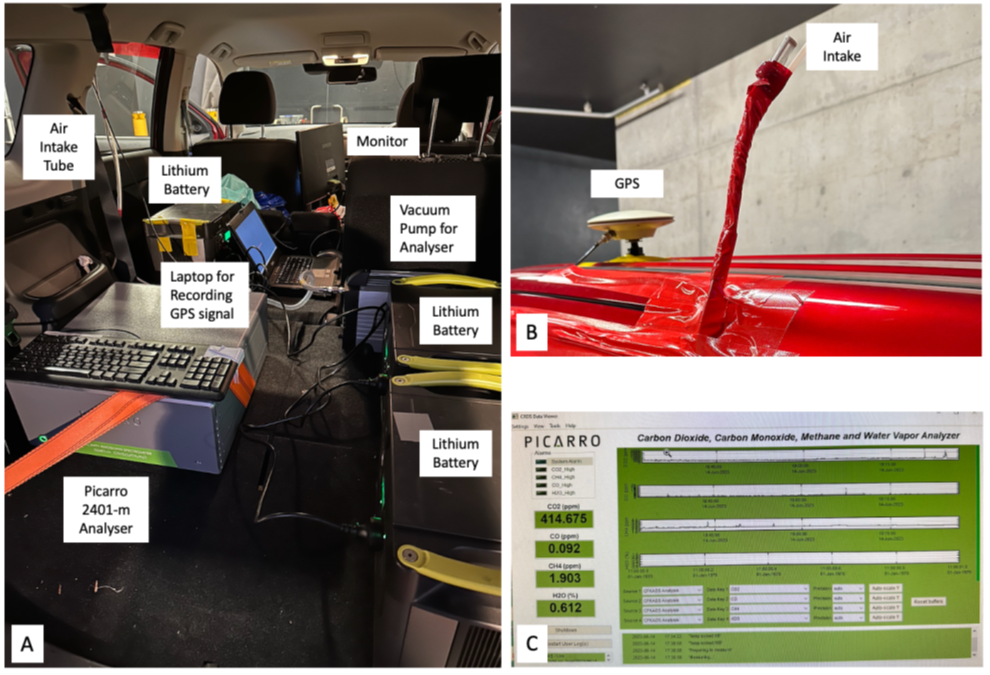
Concentrations of these gases in the atmosphere were measured using specialised equipment fitted to a vehicle. Measurements were taken from above the vehicle as it drove along the study route.
The air intake was located above the vehicle roof to avoid the measurements being compromised by emissions from the vehicle occupants and the vehicle itself. GPS readings were recorded every second. Refer to Figure 2 below.

What the survey found
The survey has been useful in identifying that car-based technologies can be useful to inform further studies, regulatory support or interventions at specific sites.
While the study was focused on testing the technology, it did identify methane plumes of varying concentrations near five EPA licensed facilities. As expected, the study found that concentrations of gases in the plumes were above background levels at the time of the survey, however, the emissions detected did not pose a health or safety risk for the community.
Carbon dioxide and carbon monoxide concentrations throughout Sydney are expected to be above background levels (recorded in Cape Grim) because of emissions from vehicles, wood fires for heating, industrial emissions, and other anthropogenic and natural sources.
Where the methane plumes were found
Methane plumes at the time of the survey were detected near:
- Bingo Eastern Creek Landfill (EPL 13426)
- Eastern Creek Waste Management Centre (EPL 5272) which is a closed landfill site; two additional licensed facilities also operate on this site, an alternative waste treatment plant and a composting facility
- Horsley Park Resource Recovery Facility (EPL 20339), a closed landfill site.
Less significant plumes were also identified near:
- Sustainable Resource Centre (EPL 5713)
- George Borg Piggery (EPL 3511).
Why these methane plumes are ‘significant’
The report used the term ‘significant’ to describe the size of the plumes detected. For example, one plume was considered ‘significant’ because it extended for approximately 1km, even though the concentration of methane within the plume was low.
‘Significant’ does not refer to concentration levels of methane within the plume. Nor does it mean the plumes posed a health or safety risk.
What methane concentrations were detected
The average methane reading on 13 June 2023 was 2.272 ppm. In comparison, the Cape Grimm (fresh air) background reference concentration for methane was 1.868 ppm.
This elevated methane concentration recorded during the study is expected to be similar to concentrations found throughout Sydney due to natural gas releases (for pressure regulation and leakage) throughout the gas network distribution system and domestic and industrial point sources.
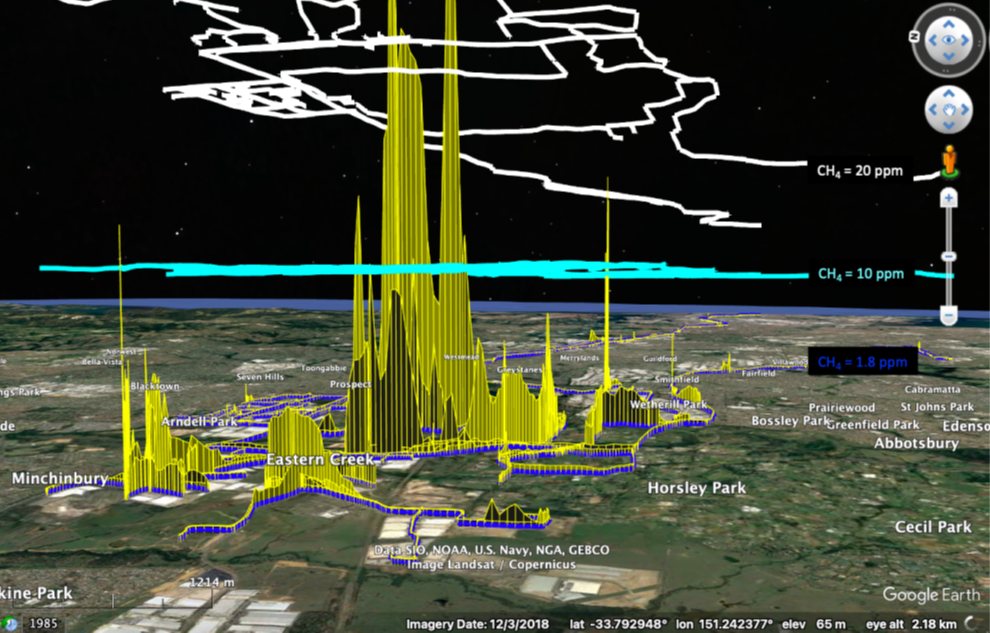
Methane concentrations within identified plumes ranged from 2.8 ppm to 58 ppm. Refer to Figure 3 for a visual summary of the survey results.
The high spikes in this figure show where methane concentrations were detected above 10ppm and the highest concentration detected was 58 ppm.
For comparison, methane concentrations must be between 50,000 ppm and 150,000 ppm for combustion to occur.

Recommendations of the report
The report recommends further onsite methane monitoring at some of the sites where methane plumes were identified to:
- pinpoint the sources of the methane emissions, and
- better understand the rate and concentration of the emissions.
This further investigation would inform better management of GHG emissions and help prioritise GHG emissions mitigation and reduction, where needed.
The study also recommends ongoing methane monitoring within the area. This could be done by establishing permanent ambient methane monitoring at two locations. Suitable locations may include:
- at the Horsley Park Bureau of Meteorology weather station, and
- at another location downwind of the facilities where methane plumes were identified.
What the EPA will do next
The EPA is continuing to work with research institutions on a range of different monitoring technologies that can be used to inform the EPA’s regulatory response to climate change.
This study has shown great benefits in utilising monitoring technologies to identify and measure GHG emission sources. This can improve the evidence base, support further EPA action and interventions, and assess the effectiveness of such actions and interventions into the future.
In relation to the specific GHG plumes identified in this report, the EPA has been working with some of the facilities to improve their gas management systems and to strengthen environmental performance requirements. These measures include pollution reduction programs and licence variations and will improve their management of greenhouse gas emissions.
The EPA will continue to work with the identified licensees, as needed, to further investigate emission sources at their facilities, including methane emissions.


