Performance of the Hunter River Salinity Trading Scheme
The Scheme has proved tremendously successful and is widely supported by the community that contributed to its creation.
We administer the scheme with guidance from an operations committee with representatives of the community, industry and the government. The scheme uses a market-based instrument to successfully address a serious environmental problem.
Performance summary: 2022–23
2022–23 continued to present challenging weather conditions for EPA, WaterNSW and scheme participants. During the first half of the financial year, July to December 2022, the Hunter River experienced significant rainfall, resulting in an unprecedented 230 river registers (discharge opportunities). This, along with similar high rainfall at the end of 2021–22, lead to continued water management issues for Scheme participants. Noting, even though there was an increased number of discharge opportunities, there was also a higher volume of site water to manage.
Due to the low flow conditions in the Hunter River in the January to June 2023 period, the salinity in the river naturally spiked well-above the salinity targets across all three sectors, only falling below them during the environmental release in June 2023.
We acknowledge the challenges for industry and will be reviewing the scheme to ensure its continuing effectiveness in extreme weather events.
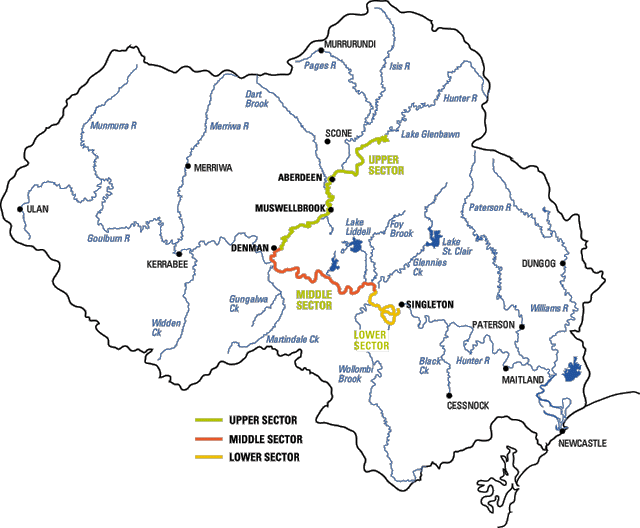
The map below identifies the locations of each sector of the Hunter River referred to in the Scheme.

How the river monitoring gauges are used
Each sector has a reference location whereby flow and salinity is monitored by WaterNSW to determine the discharge opportunity and Total Allowable Discharge (TAD) volume.
- Upper sector - Denman
- Middle sector – upstream (U/S) of Glennies Creek
- Low sector - Singleton
WaterNSW monitors and forecasts the flow and salinity of the river using a water model and telemetry network using gauges that are stationed at participant discharge points and at major tributaries. The diagram below shows a schematic of the gauging stations and participant locations with respect to their sectors.
Based on data from flow forecasts from both the tributary gauges and any high releases from Glenbawn Dam, the model calculates the total anticipated flow levels (flow routing) at Denman.
There are four tributaries that contribute to flow at Denman - Pages River, Rouchel Brook, Kingdon Ponds and Dart Brook.
Once the modelling is completed for Denman, final adjustments are made by the operator to generate the official flow and salinity forecast.
With the Denman forecast (upper sector) finalised, a similar routing procedure is performed for forecasting the flows and salinity for upstream of Glennies Creek (middle sector) and Singleton (lower sector). When the forecasts are prepared and finalised for all three reference locations, the model calculates the TAD volume for any specific discharge opportunity.

Previous performance reports
Each year we assess and report on the performance of the scheme.
- 2020–21 scheme performance report (PDF 722KB)
- 2019–20 scheme performance report (PDF 469KB)
- 2018–19 scheme performance report (PDF 308KB)
Longer-term scheme performance
While the scheme operates to manage salinity levels in the river as a result of industry discharge, occasional exceedances still occur, caused by diffuse sources of saline runoff. New mines can readily be granted discharge licences, with significant economic and employment benefits for the valley.
However, since the scheme started, river salinity has more consistently been below the salinity target.
These improvements have occurred since higher average rainfall has occurred after the scheme began, granting scheme participants more discharge opportunities and maintaining salinity targets.
The graph below shows that in previous dry spells (in the early 1980s and 1990s) average salinity levels were very high. These have not been repeated during the time since the scheme commenced.

The graph below shows the yearly average electrical conductivity at Singleton between 1993 to 2022. It shows that the average EC was higher in the period before the commencement of the Regulation in 2002 while average EC has stayed well below the target since the commencement of the Regulation.


